0%

Python matplotlib绘图时x轴标签重叠覆盖

当标签文本很长时,或者是某维度的数据列表长度很长时,都会造成标签的重叠覆盖。

解决方法有以下几种。我们使用的数据如下:

1
2
3
4
5
6
7
8
9
10
11
12
13
14
15
16
17
18
19
20
21
import pandas as pd
import matplotlib.pyplot as plt

industry = ['交通运输', '休闲服务', '传媒', '公用事业', '农林牧渔', '化工',
'医药生物', '商业贸易', '国防军工', '家用电器', '建筑材料', '建筑装饰',
'房地产', '有色金属', '机械设备', '汽车', '电子', '电气设备', '纺织服装',
'综合', '计算机', '轻工制造', '采掘', '银行', '非银金融', '食品饮料']
cap = [4572, 253, 84, 119, 23, 352, 1059, 631, 900, 95, 43, 430, 1524, 52, 1254,
2581, 3012, 195, 70, 31, 1338, 61, 111, 4964, 2782, 291]

# 生成Series
s = pd.Series(cap, industry)
# 排序
sort_s = series.sort_values(ascending=False)

# 生成x轴 y轴序列
x = sort_s.index
y = sort_s.values

fig, axs = plt.subplots()
axs.bar(x, y)

拉长画布

查看画布默认大小

1
2
plt.rcParams['figure.figsize']
[6.0, 4.0]

我们把画布拉长一倍,设置 figsize 参数。

1
2
fig, axs = plt.subplots(figsize=(12, 4))
axs.bar(x, y)

拉长以后,bar 的宽度也变大了。

由于 x 轴的数据太多了,还是有覆盖现象。

调整标签字体字号

1
2
3
4
fig, axs = plt.subplots()
# 调整x轴标签的大小
axs.tick_params(axis='x', labelsize=6)
axs.bar(x, y)

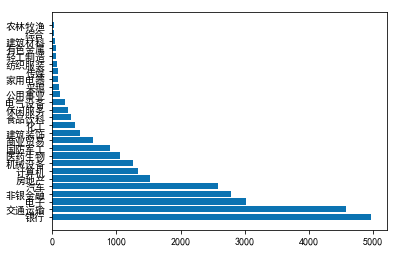
x轴和y轴互换

1
2
fig, axs = plt.subplots()
axs.barh(x, y)

标签旋转

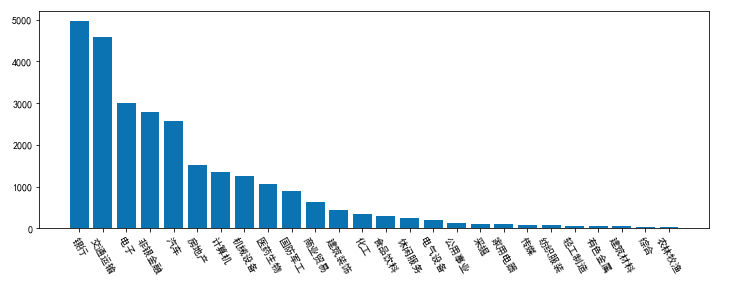
目前比较好的解决方案可能是标签旋转,再适当的放大x轴。

1
2
3
4
fig, axs = plt.subplots(figsize=(12, 4))
# x轴标签旋转
axs.tick_params(axis='x', labelrotation=-60)
axs.bar(x, y)